This guidance highlights the differences between the Scotland figures within the UK House Price Index (HPI) produced in partnership with the Office of National Statistics and Registers of Scotland’s (RoS) house price statistics.
Further information on the UK HPI is available on the UK government website, including a Quality Assurance of Administrative Data document for the data provided by RoS which is used in the UK HPI.
The RoS house price statistics covered by this guidance are the Property Market report, monthly house price statistics, and small area statistics. For more information about how we compile our house price statistics, see our guidance notes.
RoS also publishes a Country of Origin report that is created using different data and methodology. For more information, see the Quality Assurance of Administrative Data document.
Summary
The table below provides an overview of the differences between the methodology and content of the UK HPI and the RoS house price statistics.
Report information
| UK House Price Index (HPI) | RoS House Price Statistics | |||
|---|---|---|---|---|
| Links | UK HPI | Property Market report | House price statistics | Small area statistics |
| Frequency of publication | Monthly | Annually (June) | Monthly | Annually (February) |
| Reporting period covered | Monthly | Financial year | Month, quarter, calendar year | Calendar year |
| Timeliness | Published approximately six weeks in arrears, i.e. January data is first published in mid-March | Published approximately three months after the reporting period i.e. data for year-end March is published in June | Published one month in arrears i.e. January data is published on the first working day in March | Published approximately one month after the reporting period i.e. data for year-end December is published in February |
| Revisions | Revisions are made monthly to the previous 12 months to include additional registered transactions | Whole series revised in each publication | Whole series revised in each publication | Whole series revised in each publication |
Methodology information
| UK House Price Index (HPI) | Property Market Report | House Price statistics | Small area statistics | |
|---|---|---|---|---|
| Base data source | Applications for registration of residential sales in the Land Register. | Applications for registration of residential and non-residential sales, and of mortgages in the Land Register. | Applications for registration of residential sales in the Land Register. | |
| House type source | House types are derived using RoS methodology and base mapping data (Ordnance Survey ©Addressmap). | N/A | ||
| Date range of extraction | Based on the date of entry to the property | Based on the date the application is received for registration in the land register | ||
| Price Range | All market value sales | All market value sales | All market value sales | All market value sales |
| Calculation of average price | Geometric mean | Median | Median, arithmetic mean | Median, arithmetic mean |
| Methodology | Hedonic regression model to adjust for case mix | Unadjusted | Unadjusted | Unadjusted |
| Seasonal adjustment | Yes | No | No | No |
Variable information
| UK House Price index (HPI) | Property Market Report | House Price statistics | Small area statistics | |
|---|---|---|---|---|
| Volume of sales | Yes | Yes | Yes | Yes |
| House types | Yes | Yes | Yes | No |
| Cash sales | Yes | Yes | Yes | No |
| New builds | Yes | Yes | Yes | No |
| First time buyers identified | Yes | No | No | No |
| Quartiles | No | Yes | Yes | No |
Deciles | No | Yes | Yes | No |
| Geographies | UK, Scotland, and Local Authority area | Scotland, local authority area, Urban Rural Classification, city, Scottish island region | Scotland, local authority area, Urban Rural Classification, Scottish island region | Council area, health board, electoral ward, datazone, intermediate datazone, Scottish parliamentary constituency, Scottish island region |
Average house prices comparison
The chart below shows how the average house price differs depending on the method used for calculating the average. Note that the spike in the RoS median and mean in 2020 was caused by the Covid-19 pandemic.
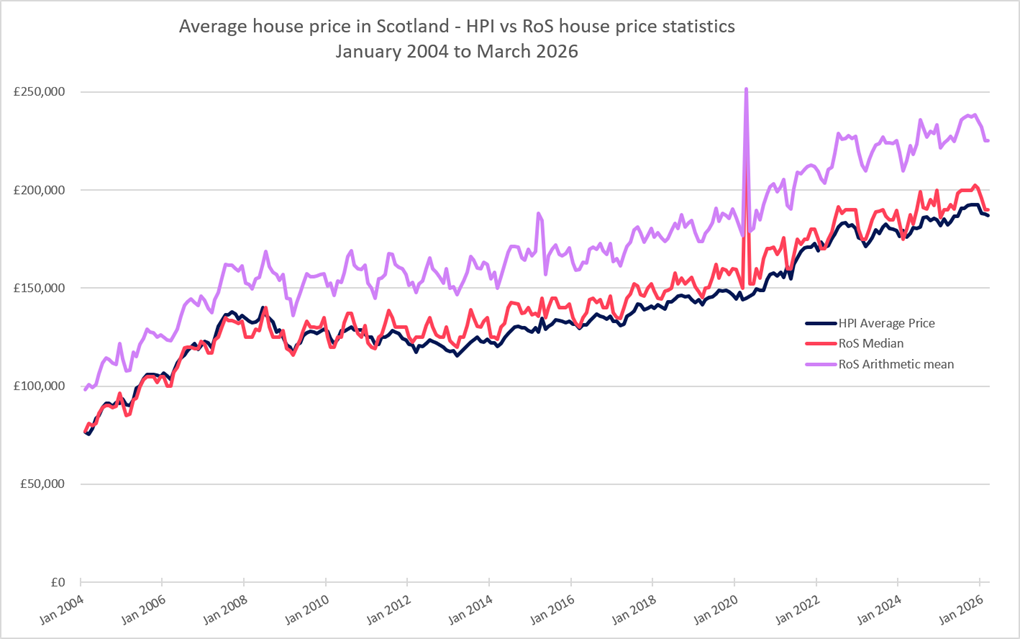
Overall, the trend of the average house price is similar for all three methodologies shown in the chart. There is some variation between the HPI and RoS figures because RoS data is based on the date of registration, while the HPI is based on the date of entry. Registration can occur up to several weeks after the date of entry. In 2025, the date of registration was within 5 days of the date of entry in half of cases, and within 25 days for 90% of cases. The whole series of RoS data is revised in each publication, whereas the HPI is fixed after 13 months, which also causes slight differences in the published figures.
Typically, the arithmetic mean will lead to a higher average price than other measures. Due to the distribution of residential property prices, the arithmetic mean can be influenced by the sale of a few high value properties. The median is the recommended measure to use in RoS statistics as it is less influenced by extreme values than the arithmetic mean and therefore provides a better indication of the "typical" house price.
The HPI uses the geometric mean which will typically be closer to the median than the arithmetic mean.
The HPI monthly figures are smoother than the RoS monthly house price statistics, again because of the different methodologies used. The HPI figures are mix adjusted, while the RoS house price statistics are unadjusted, which means the RoS figures are more prone to fluctuations in the market, for example if a high number of high or low-value sales are registered within a particular month.
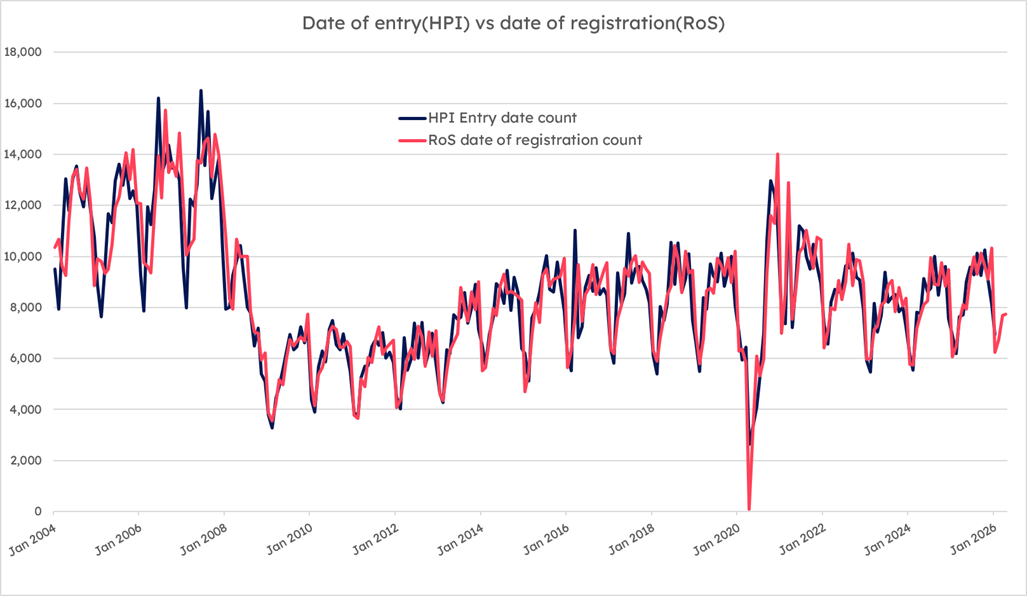
Volumes of sales comparison
There are slight differences in the volumes being presented because the RoS data is based on date of registration, while the HPI is based on date of entry. The whole series of RoS data is revised in each publication, whereas the HPI is fixed after 13 months, which also causes slight differences in the published volume figures.
The chart below shows how the volume of sales differs between the RoS data and the HPI data. Note that the drop in sales in 2020 was caused by the Covid-19 pandemic.
View further information on how we compile our statistics.